- Mathematica を起動する
- 「ファイル」メニューで,「新規作成」
- 以下 (「モジュール」) を入力して,Shift + Return:
|
vector[ {x1_, y1_}, {x2_, y2_} ] := Module[
{sen, a, b, c1, c2, c11, c12, d1, d2, d11, d12, e1, e2, p},
sen = {
Thickness[0.001],
Line[
{
{x1, y1},
{x2, y2}
}
]
};
a = x2 - x1;
b = y2 - y1;
c1 = -a Cos[15 Degree] + b Sin[15 Degree];
c2 = -a Sin[15 Degree] - b Cos[15 Degree];
c11 = x2 + c1 0.8/(Sqrt[c1^2 + c2^2] + 0.0001);
c12 = y2 + c2 0.8/(Sqrt[c1^2 + c2^2] + 0.0001);
d1 = -a Cos[-15 Degree] + b Sin[-15 Degree];
d2 = -a Sin[-15 Degree] - b Cos[-15 Degree];
d11 = x2 + d1 0.8/(Sqrt[d1^2 + d2^2] + 0.0001);
d12 = y2 + d2 0.8/(Sqrt[d1^2 + d2^2] + 0.0001);
e1 = x2 - 0.6 a/(Sqrt[a^2 + b^2] + 0.0001);
e2 = y2 - 0.6 b/(Sqrt[a^2 + b^2] + 0.0001);
p = Polygon[
{
{x2, y2},
{c11, c12},
{e1, e2},
{d11, d12},
{x2, y2}
}
];
Graphics[
{sen, p}
]
]
vectorfield[ {{a11_,a12_},{a21_,a22_}} ] := Module[
{A},
A = {
{a11,a12},
{a21,a22}
};
Show[
Table[
vector[
{x1, y1},
{x1, y1}.A
],
{x1, -5, 5},
{y1, -5, 5}
],
Axes -> True,
AspectRatio -> Automatic,
PlotRange -> {{-8, 8}, {-8, 8}}
]
]
|
- 新規フィールドでつぎ (「モジュールに代入」) を入力して,Shift + Return :
|
vectorfield[{{1.1,0.2},{0.3,1}}]
|
結果として,グラフと Out が表示される:
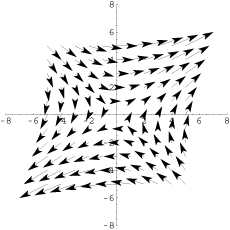
Out[2] = -Graphics-
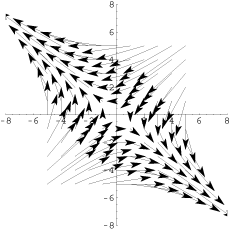
例
vecterfield[{{1,-0.5},{-0.7,1}}]
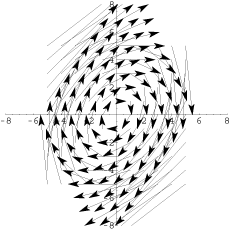
vecterfield[{{0.4,-1},{0.7,1}}]
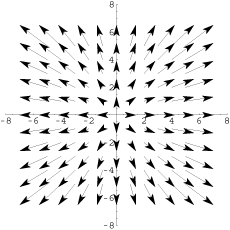
vecterfield[{{1.4,0},{0,1.3}}]
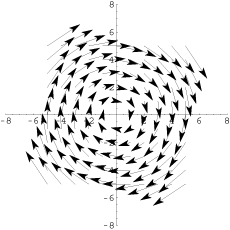
vecterfield[{{Cos[0.4],-Sin[0.4]},{Sin[0.4],Cos[0.4]}}]
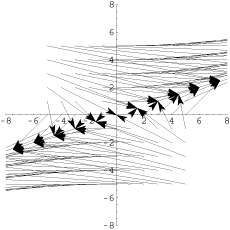
vecterfield[{{1.5,0.5},{3,1}}] (「退化」の例)
| 注意 : |
このページの「モジュール代入」の文字列 (「vectorfield[{{1.1,0.2},{0.3,1}}]」‥‥「vecterfield[{{1.5,0.5},{3,1}}]」) をコピーし,Mathematica でペーストした場合,グラフが表示されないかも知れない。
(「vectorfield」の文字コードが異常になっているようだ。)
表示されないときは,Mathematica で直接入力すること。
なお,「モジュール」の方は,このページにあるものをコピー&ペーストしてだいじょうぶ。
|
|
|