- データセットにはクラス名が含まれていない。
後で画像を出力するときのために、クラス名を保存しておく:
>>> class_names = ['0', '1', '2', '3', '4', '5', '6', '7', '8', '9']
>>>
- images (28×28 ピクセル) は,ピクセルの値が 0から255の間の整数。
ニューラルネットワークにデータを投入する前に、これらの値を0から1までの範囲にスケールする──画素の値を255で割る:
>>> x_train = x_train / 255.0
>>> x_test = x_test / 255.0
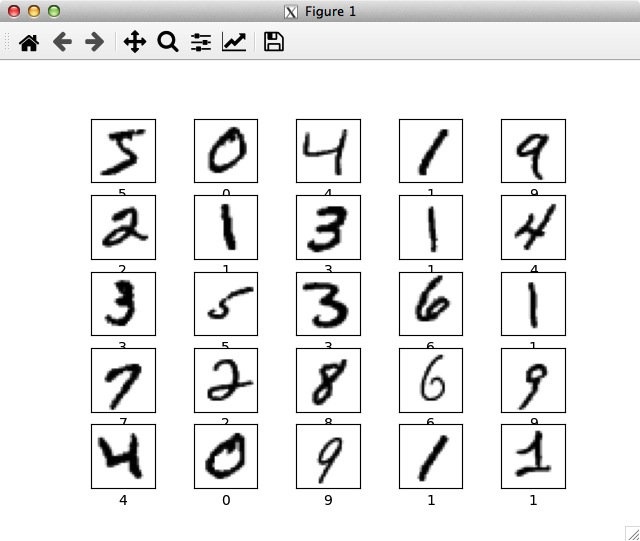
- 生成されたデータが正しいフォーマットになっていることを確認
──最初の25枚の画像を、クラス名付きで表示:
>>> plt.figure(figsize=(10,10))
<Figure size 1000x1000 with 0 Axes>
>>> for i in range(25):
... plt.subplot(5,5,i+1)
... plt.xticks([])
... plt.yticks([])
... plt.grid(False)
... plt.imshow(x_train[i], cmap=plt.cm.binary)
... plt.xlabel(class_names[y_train[i]])
...
([], [])
([], [])
<matplotlib.image.AxesImage object at 0x64cc3a30>
Text(0.5, 0, '5')
:
:
<AxesSubplot:>
([], [])
([], [])
<matplotlib.image.AxesImage object at 0x64a7e850>
Text(0.5, 0, '1')
>>> plt.show()
この画像表示をプログラムでするならば:
(venv) $ vi mnist_plt.py
| #!/usr/bin/env python
from tensorflow import keras
import matplotlib.pyplot as plt
mnist = keras.datasets.mnist
(x_train, y_train), (x_test, y_test) = mnist.load_data()
class_names = ['0', '1', '2', '3', '4', '5', '6', '7', '8', '9']
x_train = x_train / 255.0
x_test = x_test / 255.0
plt.figure(figsize=(10,10))
for i in range(25):
plt.subplot(5,5,i+1)
plt.xticks([])
plt.yticks([])
plt.grid(False)
plt.imshow(x_train[i], cmap=plt.cm.binary)
plt.xlabel(class_names[y_train[i]])
plt.show()
|
(venv) $ chmod +x mnist_plt.py
(venv) $ ./mnist_plt.py
|